How ethanol plants can separate wet-cake variability, syrup-blending effects, dryer performance and post-cooler moisture pickup—then connect a continuous online trend to a defined DDGS laboratory reference.
Why DDGS moisture is a dryer-house and handling question
Distillers dried grains with solubles (DDGS) is not simply “dried grain.” In a typical dry-mill ethanol plant, the stillage route separates solids from whole stillage; thin stillage can be recycled as backset or concentrated by evaporation; and condensed solubles may be recombined with the solids before drying. The U.S. EPA's distillery process documentationdescribes this sequence and notes that steam-heated or flash dryers are commonly used. That sequence means a dryer-discharge moisture signal must be interpreted alongside wet-cake condition, solubles addition, throughput and the product's cooling and handling history.
The reason for drying is practical as well as commercial. USDA's Economic Research Service says distillers grains intended for shipment are commonly dried to roughly 10% to 15% moisture, which raises production cost but extends shelf life and reduces hauling cost. Its DDGS overviewgives that range as industry context, not a product specification. A plant's actual release limit must be set by its feed-safety program, customer agreement, product grade, packaging or bulk-shipping method, climate and validated storage plan.
The measurement challenge: do not mix four different moisture questions
Moisture at the centrifuge or press exit indicates dewatering performance and the water load entering the dryer house. Moisture after condensed-solubles blending reflects a changed feed composition and thermal load. Moisture at dryer discharge supports a drying decision. Moisture after cooling, screening or transfer is closer to the condition seen by storage, load-out or a feed mill. A single reading cannot identify the cause of an excursion unless its place in that sequence is clear.
This distinction is especially important because DDGS flow is influenced by more than water content. The U.S. Grains Council's DDGS handbook identifies moisture and ambient relative humidity as major contributors to bridging, caking and poor flowability, while also naming particle size, solubles proportion, dryer temperature and dryer-exit moisture as relevant factors. Its handling chapter notes that drying below 12% is generally assumed acceptable only under moderate temperature and humidity and that long-term optimum storage conditions have not been established. Use that as a design caution rather than treating 12% as a guaranteed no-caking threshold.
Make the water load visible with a wet-basis mass balance
A wet-basis calculation helps operators see why small percentage changes matter at high throughput. For example, one metric tonne of material at 35% moisture contains 650 kg dry solids and 350 kg water. If dry solids are conserved and that stream leaves a dryer at 12% moisture, the corresponding product mass is 650/(1 − 0.12) = 739 kg. The difference, about 261 kg, is water removed. This is a mass-balance illustration, not a recipe for a dryer or a finished-DDGS target; real plants must account for solubles addition, recycle, dust collection, sampling basis and any other stream changes.
Use the calculation comparatively. A moving dryer-feed moisture trend, together with wet-feed mass rate and dryer-discharge moisture, can tell the team when the evaporative load has changed. It cannot by itself show whether the cause is centrifuge performance, syrup ratio, uneven mixing, bed depth, dryer-gas conditions or a measurement problem. Those variables should be recorded with each verified excursion.
Recommended instrumentation approach
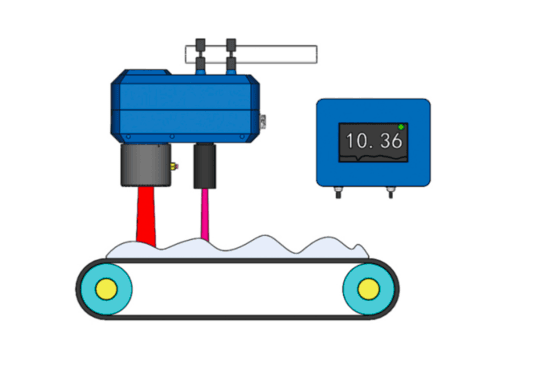
For a consistent, exposed layer of DDGS on a conveyor after drying or cooling, assess a non-contact online NIR moisture analyzer when a rapid surface-oriented trend is enough for the decision. The installation needs stable product presentation, repeatable layer coverage, controlled sensor distance and an optical path protected from dust, steam, condensation and window fouling. Reference samples must come from the same stream and time represented by the sensor.
Where the operating decision depends on a deeper or less-uniform bulk layer, assess a microwave moisture measurement system. A through-layer arrangement with loading compensation can be a stronger fit when bed depth and bulk density vary and a bulk-stream signal is needed. Technology selection should follow the required sampling volume, physical installation, product temperature, dust environment, particle-size distribution, likely composition variation and intended action—not a generic accuracy claim. ALZRO's technology overview describes the practical distinction between surface-oriented NIR and through-layer microwave measurement.
Installation points tied to a named operating action
- After centrifuging or pressing: trend dewatering performance and incoming dryer load before solubles addition changes the stream.
- After wet-cake and condensed-solubles blending: expose variation in the actual dryer feed, provided the blend is sufficiently homogeneous and a representative sample can be collected.
- At dryer discharge: support dryer monitoring with enough downstream transport time to investigate gas conditions, feed rate, recycle or residence-time changes.
- After cooling, before storage or load-out: verify the condition closer to the handling interface and distinguish a drying issue from post-dryer moisture pickup.
Select the point in a site survey, not from a generic layout. Document material temperature, conveyor speed and loading, bed depth, flow profile, product fines, recycle location, syrup addition and mixing, dust extraction, air leakage, ambient humidity, maintenance access, cleaning method, sample location and the transport time from sensor to any operator response. A safe, representative sample point is part of the measurement system—not an afterthought.
Calibration and verification: agree the laboratory truth first
Calibrate an online signal against a named, site-approved reference rather than an undefined “oven loss.” The U.S. Grains Council's recommended DDGS analytical procedures list NFTA Method 2.2.2.5, laboratory dry matter at 105 °C for 3 hours, for moisture in DDGS trading standards. The handbook's laboratory-procedures chapterprovides the method and conditions. Confirm the plant's applicable contract, laboratory equipment, sample preparation, reporting basis and any local requirements before using it as the reference; this article does not substitute for those controls.
- Time-align every paired result: allow for material travel, mixing, dryer and cooler residence time, sample transport and laboratory turnaround.
- Capture normal production variation: include different wet-cake conditions, solubles ratios, product temperatures, throughput, grades, particle presentation and genuine moisture excursions in the validation set.
- Control the sample itself: take representative increments, seal promptly to limit moisture change, identify sample location and time, and retain the plant's documented chain of custody.
- Commission in stages: prove stable trend direction against the approved reference, then define averaging, alarms, resampling rules and operator responses before considering automatic process changes.
Quality and energy benefits to prove on site
A continuous moisture trend can shorten the time between a feed or dryer disturbance and a targeted check. With an agreed response plan, it can help distinguish increased dryer load from a post-cooler or storage issue, direct laboratory work toward meaningful excursions and reduce reliance on an unnecessarily wide drying margin. It does not demonstrate a fixed energy saving, prevent every flowability event or guarantee a feed-quality result by itself.
Build the business case from plant data: paired online and reference values, wet-cake dry solids, solubles-addition rate, dryer fuel or steam, dryer-gas and discharge temperatures, throughput, recycle, cooling-air condition, product bulk density, rejected or reworked material, storage observations and load-out events. This gives production, quality and commercial teams a common record for deciding whether measurement is improving the process they actually operate.
Sources
- U.S. EPA, Emission Factor Documentation for AP-42 Section 9.12.3: Distilled Spirits. Process description for grain stillage separation, thin-stillage concentration, recombination and drying.
- U.S. Department of Agriculture, Economic Research Service: Dried Distillers Grains. Industry context for roughly 10% to 15% DDGS moisture, transport and shelf life.
- U.S. Grains Council, Precision DDGS User Handbook, Chapter 7. Recommended DDGS laboratory procedure: NFTA 2.2.2.5, 105 °C for 3 hours.
- U.S. Grains Council, Precision DDGS User Handbook, Chapter 9. Handling, storage, moisture, humidity, caking and flowability context.
- Akinola et al. (2021), Foods: Impacts of Ethanol Production and Drying Conditions on DDGS Properties. Peer-reviewed discussion of physical, chemical and flowability factors in DDGS.